
|

|
|
|
|
|
LTS Tour: OUTPUT In addition to lap time and average speed, LTS provides well over 100 outputs at
up to 2000 locations around the track. Outputs include those analogous to
on-board instrumentation as well as many vehicle parameters which cannot be
directly measured on a real vehicle. Outputs at each point on the track include:
To view the output list from the LTS User's Manual click here. Output from LTS is available in several forms:
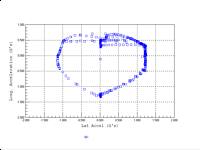
*Pi V6 Software is a registered trademark of Pi Research Ltd. LTS also has its own Windows-based plot program, Lap Time Graph (LTG). This utility plots LTS output against distance, time or location around the race course. Sample plots are shown below. The LTG program contains approximately 45 plots, many with multiple traces. LTS TOUR
<< Previous | Next >>
|
|
|
Home | Services | Software | Books | News Briefs | About MRA | Contact Us | Site Map |
|
 
|


